A jQuery horizontal bar chart with Bootstrap: hBarChart
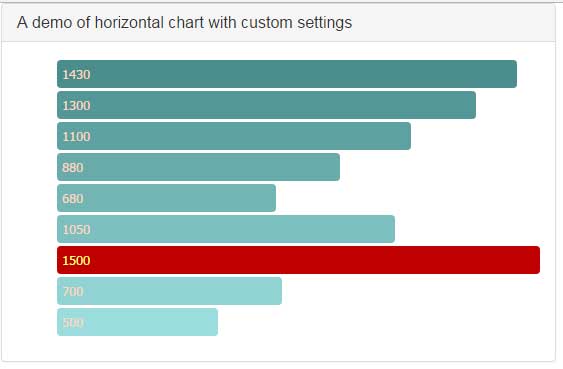
The horizontal bar chart plug-in for jQuery For creating the horizontal bar chart plug-in, you may use a jQuery solution hBarChart. This solution requires using the HTML lists where each <li> represents a bar. The plug-in can be initiated by a single line of code or use the available options for customizing e.g. color of … Read more