
The column chart
Presenting information in a graphical format like bar charts, columns etc. is always eye catching and says many words than lots of textual information.
In this tutorial, I am going to show you a columns chart that is based on Bootstrap and jQuery. The jQuery part is just a few lines of code (no external JS file other than the jQuery library is required).
The markup contains Bootstrap classes and custom CSS for creating columns for the chart. First, have a look at demos which is followed by the guide to set up this chart for your project.
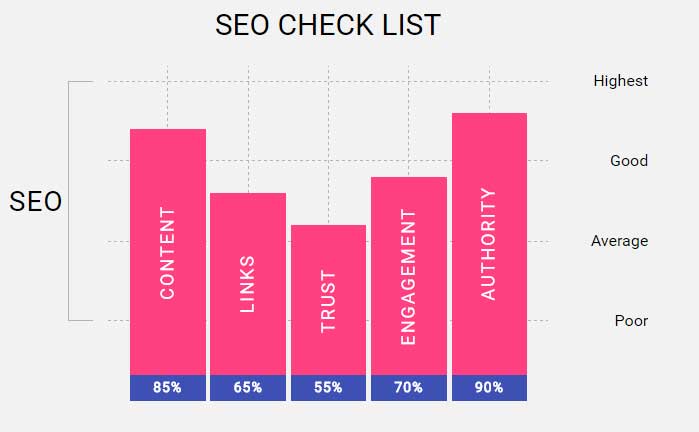
An example of SEO chart
In this example, I have created an SEO chart for the activities based on its importance. The chart contains activities like creating content, earning backlinks, trustworthiness of content, authority, and engagement of the users. The chart bars or percentage is only for demonstration purpose. In real, it may vary.
See online demo and code
So, how is this chart created? First of all, if you are not already done, include the Bootstrap CSS and jQuery library in the <head> section.
The <style> section contains custom CSS that defines the color scheme and other properties of the charts. See this in the demo page.
In the markup section, the legend-title class is used for creating legend like SEO or whatever purpose the chart is created for.
The <div> containing legend legend-right with item classes specify the levels in the chart like Highest, High, Good, Poor etc.
While the .bar class in the <div> is used to specify the percentage by using data-percent attribute and inside this you will also specify the title of that bar, for example, Content, Links, Engagement etc. in the demo.
Similarly, you will create the required number of vertical bars in the chart. Finally, just above the </body>closing tag, the code of jQuery is written.
You may get the complete code of this example in the demo page’s code section.
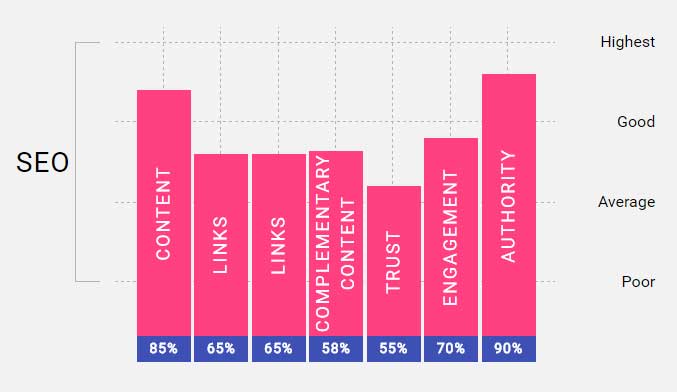
Adding more bars in chart example
As mentioned earlier, you may use the .item class with .bar for creating as many bars as you need in the chart (depending on the available space). In this example, I have added three more bars for the demonstration only:
See online demo and code
This markup is used for single chart bar:
<div class="item">

<div class="bar">

<span class="percent">65%</span>


<div class="item-progress" data-percent="65">

<span class="title">Links</span>

</div>

</div>

</div>
Get the complete code in the demo page.
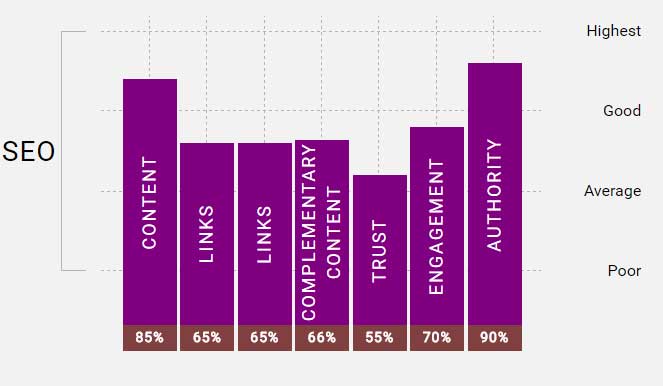
A demo of changing the colors of bars
By changing the custom CSS in the <style> section, you may change the colors of bars to match with the rest of design of your website. For that, simply find and change the properties of CSS like background-color etc.
Check out this demo where I just changed the colors of bars for showing percentage.
See online demo and code
In order to change the colors as shown in the demo, you simple need to change .column-chart > .chart > .item > .bar > .item-progress and .column-chart > .chart > .item > .bar > span.percent properties.
Credits: Berg