
The jquery-plugin-circliful for creating circle data presentation
The circliful enables creating the SVG based circles for statistical information on web pages. It uses font-awesome icons that allow adding icons to make statistical circles even more descriptive.
No images are used, so it is light weight with many options that can be set by using jQuery or data attributes. The circular data representation is fully responsive so it adapts to the user’s screen.
Developer’s page Download plug-in
Setting up circliful plug-in
Include the CSS and JS files of the plug-in; CSS in the <head> section:
<link rel=”stylesheet” href=”css/circliful/jquery.circliful.css”>
The JS file before the </body> tag and below the jQuery file:
<script src=”js/circliful/jquery.circliful.js”></script>
Using markup
The markup is just a container like a div element where statistic circle will appear with a unique ID, for example:
<div class="col-lg-2">

    <div id="circle-staticstic-demo"></div>

</div>
Call the plug-in
By using the unique ID of the element containing the circle, initiate the plug-in with options:
        $("#circle-staticstic-demo").circliful({

            animation: 1,

            animationStep: 5,

            foregroundBorderWidth: 15,

            multiPercentage: 1,

            percentages: [10, 20, 30]

        });
See the section below for demos and code with various options.
A demo of simple circle with a few options
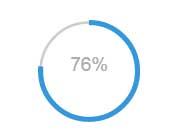
The demo below shows a simple usage of the circliful plug-in. A few options (among many) are used to specify the circle. The animation option specifies whether to load the circle with animation or initially filled.
Specify the circle inner and out border widths by using the foregroundBorderWidth and backgroundBorderWidth options. The percent option is for specifying the percentage of the circle to be filled and you may also set the text properties for showing the percentage:
Online demo and code
The markup:
<section class="container">


 <h3>A demo of Statistical Circliful</h3>


<div class="row">

    <div class="col-lg-2">

        <div id="circle-staticstic-demo"></div>

    </div>


</div>
The script:
        $("#circle-staticstic-demo").circliful({

            animation: 1,

            foregroundBorderWidth: 6,

            backgroundBorderWidth: 3,

            percent: 76,

            textSize: 25,

            textStyle: 'font-size: 14px;',

            textColor: '#666',

            multiPercentage: 1


        });
A demo of using font-awesome icon in circle graph
The following options deal with the icons inside the circle:
- icon: //Specify the icon code
- iconColor //icon color like hexadecimal value
- iconSize //An integer value for specifying the size of the icon
- iconPosition: //Set the position of icon. You may set top, middle, right, left and bottom
Have a look:

The script and markup:
<!DOCTYPE html>
<html>
<head>
    <link rel="stylesheet" href="https://maxcdn.bootstrapcdn.com/bootstrap/3.3.6/css/bootstrap.min.css">
    <link rel="stylesheet" href="https://maxcdn.bootstrapcdn.com/font-awesome/4.5.0/css/font-awesome.min.css">
    <link rel="stylesheet" href="css/circliful/jquery.circliful.css">

</head>
<body>
<section class="container">

 <h3>A demo of Statistical Circliful</h3>

<div class="row">
    <div class="col-lg-2">
        <div id="circle-staticstic-demo"></div>
    </div>

</div>


</section>

<script src="https://ajax.googleapis.com/ajax/libs/jquery/1.11.3/jquery.min.js"></script>

<script src="js/circliful/jquery.circliful.js"></script>
<script>
    $( document ).ready(function() {
        $("#circle-staticstic-demo").circliful({
            animation: 1,
            animationStep: 10,
            foregroundBorderWidth: 5,
            backgroundColor: "none",
            fillColor: '#E1F5FF',
            percent: 95,
            iconColor: '#FF0000',
            icon: 'f1eb',
            iconSize: '35',
            iconPosition: 'middle'

        });
    });

</script>
</body>
</html>
You can see, the wifi icon is used which code is “f1eb”. You can see the list of codes for font-awesome icons here.
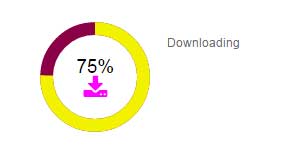
A demo of caption and icon with text
In this demo, the icon is displayed along with the percentage inside the circle graph. Towards the outer side, the caption is also displayed that can be in the context of the statistical circle:
The jQuery code:
    $( document ).ready(function() {

        $("#circle-staticstic-demo").circliful({

            animation: 1,

            animationStep: 1,

            target: 5,

            start: 15,

            showPercent: 1,

            backgroundColor: '#8A0045',

            foregroundColor: '#F2F200',

            fontColor: '#000',

            iconColor: '#FF00FF',

            icon: 'f019',

            iconSize: '30',

            iconPosition: 'bottom',

            multiPercentage: 1,

            text: 'Downloading'


        });

    });
You saw the downloading icon is used from the font-awesome library while the caption is used as “Downloading”. Inside the circle, the position of the icon is set as bottom while the percentage is also displayed.
You may also use the data attributes rather than using the JavaScript for creating the circle graphs. For example, data-icon=”f019″, data-animationStep=”10″ etc.. Just add the “data-“ prefix with the option. See an example below.
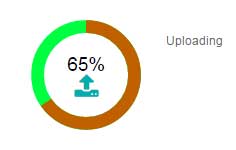
An example of data attributes for creating the circle
Almost the same circle is created as in above example but this time using the data attributes. The following data attributes are used:
- data-animation
- data-animationStep
- data-icon
- data-target
- data-percent
- data-showPercent
- data-backgroundColor
- data-foregroundColor
- data-fontColor
- data-iconColor
- data-iconSize
- data-iconPosition
- data-multiPercentage
- data-text
Have a look:
The markup and jQuery for this example:
<!DOCTYPE html>
<html>
<head>
    <link rel="stylesheet" href="https://maxcdn.bootstrapcdn.com/bootstrap/3.3.6/css/bootstrap.min.css">
    <link rel="stylesheet" href="https://maxcdn.bootstrapcdn.com/font-awesome/4.5.0/css/font-awesome.min.css">
    <link rel="stylesheet" href="css/circliful/jquery.circliful.css">

</head>
<body>
<section class="container">

 <h3>A demo of Statistical Circliful</h3>

<div class="row">
    <div class="col-lg-2">
        <div id="circle-staticstic-demo" data-animation="1" data-animationStep="5" data-icon="f093" data-target="5" data-percent="65"
        data-showPercent= "1" data-backgroundColor= "#00FF40" data-foregroundColor="#BF6000" data-fontColor= "#000" data-iconColor= "#00AEAE"
        data-iconSize="30" data-iconPosition="bottom" data-multiPercentage="1" data-text="Uploading" ></div>
    </div>

</div>


</section>

<script src="https://ajax.googleapis.com/ajax/libs/jquery/1.11.3/jquery.min.js"></script>

<script src="js/circliful/jquery.circliful.js"></script>
<script>
    $( document ).ready(function() {
        $("#circle-staticstic-demo").circliful({
        });
    });

</script>
</body>
</html>
You can see, only the plug-in is initiated by using the jQuery code while all options are set by using the data attributes.
For the full available list of options, go to the plug-in’s developer page.