
The KlondikeChart plug-in
The jQuery-based KlondikeChart plug-in can be used for creating the line and donut charts on your website.
This is a light-weight plug-in that requires adding a script file after the jQuery reference. You also need to include the jCanvas plug-in in the <head> section of the website.
See the demo and code in the following section along with the setting up instructions.
A demo of creating a jQuery line chart
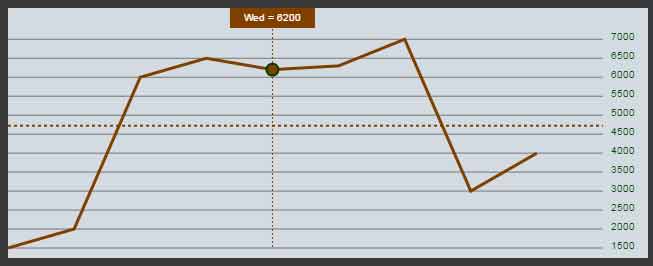
For creating a line chart plug-in, you simply need to use the jQuery code with the plug-in LineChart() function and declare a few variables. Have a look at this live demo with code:
See online demo and code
Setting up this plug-in to work
You need to include following files in the <head> section:
<link href="css/KlondikeChart/KlondikeChart-MainCss.css" rel="stylesheet" type="text/css">

<script src="http://code.jquery.com/jquery-1.12.4.min.js"></script>

<script src="https://cdnjs.cloudflare.com/ajax/libs/jcanvas/16.7.3/jcanvas.min.js"></script>

<script src="js/KlondikeChart/KlondikeChart-v1.5.js"></script>
Note: The path will change according to your own specification.
The simple markup for the demo of line chart:
<div class="container">

<h2>A demo of jQuery Line Chart</h2>

<canvas id="linechart-demo" width="640" height="250"></canvas>

</div>
The jQuery code:
<script>

var myLineCanvas = $("#linechart-demo");

    var lineColor = "#804000";

    var lineStroke = 3;

    var CanvasBackground = "#D3DBE2";

    var gridLineColor = "#767676";

    var gridNumeralColor = "#004000";

    var gridLineFrecuency = 500;

    var GridNumeralDecimals = 0;

    var ChartAvarage = true;

    var XValues = ["Sat", "Sun", "Mon", "Tue", "Wed", "Thu", "Fri","Sat","Sun"];

    var YValues = [1500, 2000, 6000, 6500, 6200, 6300, 7000,3000,4000];

    LineChart();


</script>
In the script section, you can see a few straightforward variables for setting the line chart options. For example, the XValues and YValues define the information to be displayed at each point of the line chart. In the demo, I used Weekday names with corresponding values.
Similarly, you may set the color of the line by assigning a color value to the lineColor variable. The CanvasBackground defines the background color of the canvas.
You may also customize the grid line color, lineStroke, gridline frequency by using the respective variables.
A demo of donut chart by using the same plug-in
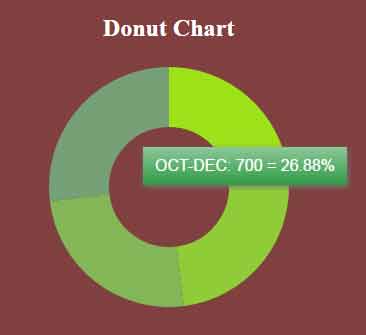
By using the same plug-in, you may create a donut chart based on jQuery as well. See this demo where I used an array of values to be displayed i.e. quarters from Jan to Mar, Apr to June and so on with respective numeric values.
See online demo and code
The markup for this demo:
<div class="container">

<h2>Donut Chart</h2>

<canvas id="donutchart-demo" width="640" height="350"></canvas>

</div>
The script:
<script>


var myDonutCanvas = $("#donutchart-demo")

    var DonutRadius = 90; //Set the radius of chart

    var DonutStroke = 60; //Defines the donut width

    var DonutXPosition = 320;

    var DonutYPosition = 125;

    var statsNames = ["JAN-MAR", "APR-JUN",  "JUL-SEP", "OCT-DEC"]; //An array of strings like day names, months etc.

    var stats = [600, 650, 654, 700]; //The respective values for each array item

    DonutChart();

</script>
You may workout the JS and CSS files to customize the color scheme.
Credit: aureliosanchez (plug-in download link)