
The bar graph plug-in
The jquery-graph is a simple-to-use jQuery plug-in for creating bar graphs On your website. It simply requires adding the plug-in JS file, CSS file and using a few attributes in the HTML table as shown in the live examples below.
The plug-in can be downloaded from the Github website here or you may view source the demo page and find the graph.js, bar.css, and style.css in the jquery-graph folders. Just download these files in your system.
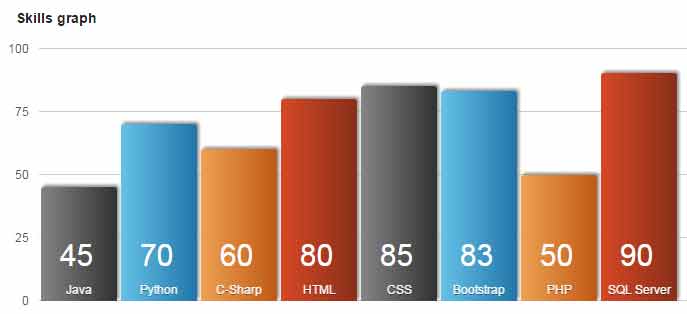
A demo of bar chart by using jQuery plug-in
See the demo online where a few development tools and technologies are used to present the skill level by using the bar chart.
Online demo and code
You need to include the following CSS files for the demo like look in the <head> section:
<link rel=”stylesheet” href=”css/jquery-graph/style.css”>
<link rel=”stylesheet” href=”css/jquery-graph/bar.css”>
Just above the </body> tag:
<script src=”http://code.jquery.com/jquery-1.12.4.min.js”></script>
<script src=”js/jquery-graph/graph.js”></script>
The markup:
<div id="wrapper"> <div class="chart"> <h3>Skills graph</h3> <table id="data-table"> <thead> <tr> <td> </td> <th scope="col"></th> </tr> </thead> <tbody> <tr> <th scope="row">Java</th> <td>45</td> </tr> <tr> <th scope="row">Python</th> <td>70</td> </tr> <tr> <th scope="row">C-Sharp</th> <td>60</td> </tr> <tr> <th scope="row">HTML</th> <td>80</td> </tr> <tr> <th scope="row">CSS</th> <td>85</td> </tr> <tr> <th scope="row">Bootstrap</th> <td>83</td> </tr> <tr> <th scope="row">PHP</th> <td>50</td> </tr> <tr> <th scope="row">SQL Server</th> <td>90</td> </tr> </tbody> </table> </div> </div>
How to change the default colors of the bars?
The bar colors are managed in the bar.css file. Just open that file in any editor of your choice and find the classes starting with Fig.
For example, look at this demo where I changed the default scheme of Java, Python, CSS, and Bootstrap than the default style. Have a look and I will explain which classes are changed exactly:
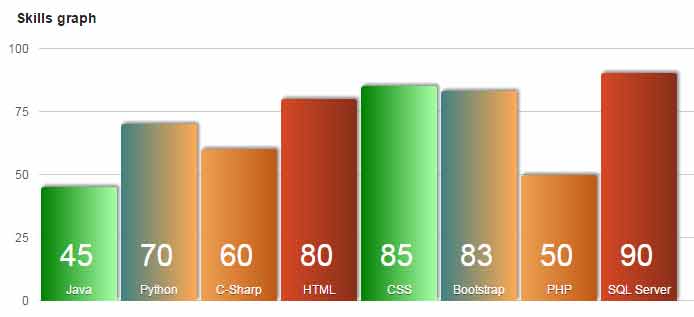
Only these classes’ background colors are changed with the new values in the bar.css file:
.fig0, .fig4, .fig8{

  background: #858585; /* For browsers that do not support gradients */

  background: -webkit-linear-gradient(left, #858585 , #323232); /* For Safari 5.1 to 6.0 */

  background: -o-linear-gradient(right, #858585 , #323232); /* For Opera 11.1 to 12.0 */

  background: -moz-linear-gradient(right, #858585 , #323232); /* For Firefox 3.6 to 15 */

  background: linear-gradient(to right, #008000 , #A8FFA8); /* Standard syntax */

}

.fig1, .fig5, .fig9 {

background: #65c2e8; /* For browsers that do not support gradients */

  background: -webkit-linear-gradient(left, #65C2E8 , #2075A8); /* For Safari 5.1 to 6.0 */

  background: -o-linear-gradient(right, #65C2E8 , #2075A8); /* For Opera 11.1 to 12.0 */

  background: -moz-linear-gradient(right, #65C2E8 , #2075A8); /* For Firefox 3.6 to 15 */

  background: linear-gradient(to right, #408080 , #FFA953); /* Standard syntax */

}
Similarly, you may change other properties for other bars and display text to customize this bar chart plug-in to match the theme of your website.
Credit: atoyansk