
The horizontal bar chart plug-in for jQuery
For creating the horizontal bar chart plug-in, you may use a jQuery solution hBarChart. This solution requires using the HTML lists where each <li> represents a bar.
The plug-in can be initiated by a single line of code or use the available options for customizing e.g. color of bars, text color, sorting etc.
Developer’s page Download plug-in
How to use the hBarChart plug-in?
Download this light-weight plug-in from the GitHub website by the above download link or visit the developer’s page.
Include the reference of horizontal bar chart plug-in:
<script src=”js/jquery-hBarChart/hBarChart.js”>
(Place this line after the jQuery reference)
See the demos below for the markup using Bootstrap framework.
Initiate the plug-in with default options:
$(“.horizontal-chart-demo”).hBarChart();
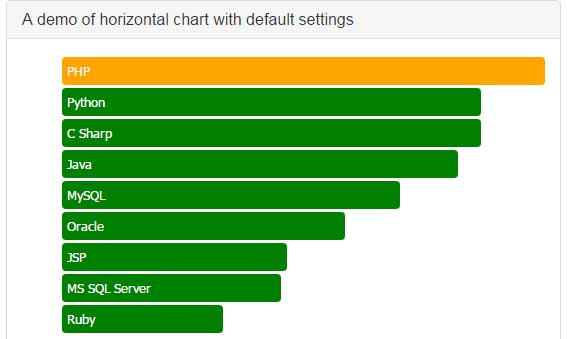
A demo of bar chart with default settings
In this example, the bar chart is created with the default settings. See the markup and code below:
The markup and script:
<!DOCTYPE html>
<html>
<head>
        <script data-require="jquery@2.2.4" data-semver="2.2.4" src="https://ajax.googleapis.com/ajax/libs/jquery/2.2.4/jquery.min.js"></script>
        <link data-require="bootstrap@3.3.6" data-semver="3.3.6" href="https://maxcdn.bootstrapcdn.com/bootstrap/3.3.6/css/bootstrap.min.css" rel="stylesheet"/>
        <script data-require="bootstrap@3.3.6" data-semver="3.3.6" src="https://maxcdn.bootstrapcdn.com/bootstrap/3.3.6/js/bootstrap.min.js">
        </script>
        <script src="js/jquery-hBarChart/hBarChart.js">
        </script>
        <script>

$(function() {
    $(".horizontal-chart-demo").hBarChart();
})
        </script>
</head>
<body>
        <section>
            <div class="container">
                <div class="row">
                    <div class="col-md-6">
                        <div class="panel panel-default">
                            <div class="panel-heading">
                                <h3 class="panel-title">
                                    A demo of horizontal chart with default settings
                                </h3>
                            </div>
                            <div class="panel-body">
                                <div>
                                    <ul class="horizontal-chart-demo">
                                        <li data-data="1230">
                                            Java
                                        </li>
                                        <li data-data="1300">
                                            Python
                                        </li>
                                        <li data-data="1300">
                                            C Sharp
                                        </li>
                                        <li data-data="880">
                                            Oracle
                                        </li>
                                        <li data-data="680">
                                            MS SQL Server
                                        </li>
                                        <li data-data="1050">
                                            MySQL
                                        </li>
                                        <li data-data="1500">
                                            PHP
                                        </li>
                                        <li data-data="700">
                                            JSP
                                        </li>
                                        <li data-data="500">
                                            Ruby
                                        </li>
                                    </ul>
                                </div>
                            </div>
                        </div>
                    </div>
                    <!--6 end -->

                </div>
            </div>
        </section>

        <!-- chart1 -->

</body>
</html>
Customizing the plug-in by using options
The plug-in allows you changing the color of the bars with limitation. You may change the color and text of the bar with maximum value. While all other bars will be given one color. However, the good thing is, the color will become lighter as bars go down.
To change the color of all bars, use these options:
bgColor: ‘#418383’, //Color name or hexadecimal color value
textColor: ‘#FFD5BF’,
For the max bar:
maxStyle: {
bg: ‘#BF0000’, // Color name or hexadecimal color value
text: ‘#FFFF82’
}
Another option is sorting with the possible values of true or false. The default is true, that will make the bars appearing with maximum to minimum values. For the demo below, I used the false value:
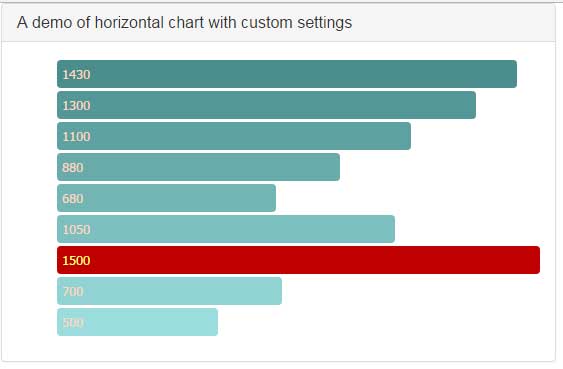
See online demo and code
The script for this example:
$(function() {

      $(".horizontal-chart-demo").hBarChart({

        bgColor: '#418383',

        textColor: '#FFD5BF',

        show: 'data',

        sorting: false,

        maxStyle: {

            bg: '#BF0000',

            text: '#FFFF82'

        }

  });

})
Read more about this nice and simple plug-in by visiting the developer’s page.