
The simple-chart plug-in
The simple-chart plug-in is used to create the charts in web pages. The pattern of the chart can be specified in different ways e.g. columns charts, step chart, progress chart etc.
The labels and their respective values can be given using the JavaScript that you may fetch from the database. The type option of the plug-in allows you creating the type of chart like if it is a column, bar, progress etc. chart.
Developer’s page Download plug-in
See the coming section for using different options and how to set up this simple chart plug-in.
Setting up the simple chart plug-in
Grab the plug-in from the above download link. Place the CSS file in the <head> section and JS file at the last of a web page.
<link rel=”stylesheet” href=”css/jquery-simple-chart/simple-chart.css”>
JS file after the jQuery library:
<script src=”js/jquery-simple-chart/simple-chart.js”></script>
The script contains the data for the charts; labels, values, chart type etc. See the demos and functional code below.
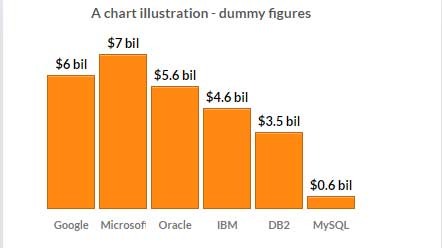
A demo of column chart
In this demo of columns chart, the dummy data is used for the illustration purpose only. Following options are used for creating the chart:
- text: //“Heading of the chart”
- type: //column or progress or waterfall etc.
- layout: // defining the height and width
- item: // specifies the label, value, color of bars etc.
- and more
See the demo and code:
The code:
<!DOCTYPE html>
<html>
<head>
    <link rel="stylesheet" href="css/jquery-simple-chart/simple-chart.css">
    <link href="https://fonts.googleapis.com/css?family=Montserrat:300,400,600|Lato:300, 400i,700,700i" rel="stylesheet">
    <style>
        body { padding:100px; background-color:#eaeff5 }
        section { float:left; width:100%; padding:10px; margin:40px 0;  background-color:#fff; box-shadow:0 15px 40px rgba(0,0,0,.1) }
    </style>

</head>
<body>
    <div class="sc-wrapper">
        <section class="sc-section">
            <div class="column-chart-demo"></div>
        </section>

    </div>
    <script src="https://cdnjs.cloudflare.com/ajax/libs/jquery/3.1.1/jquery.min.js"></script>
    <script src="js/jquery-simple-chart/simple-chart.js"></script>
    <script>
        //        Source: https://stackoverflow.com/questions/10599933/convert-long-number-into-abbreviated-string-in-javascript-with-a-special-shortn
        function abbreviateNumber(arr) {
            var newArr = [];
            $.each(arr, function (index, value) {
                var newValue = value;
                if (value >= 1000) {
                    var suffixes = [" ", " K", " mil", " bil", " t"];
                    var suffixNum = Math.floor(("" + value).length / 3);
                    var shortValue = '';
                    for (var precision = 2; precision >= 1; precision--) {
                        shortValue = parseFloat((suffixNum != 0 ? (value / Math.pow(1000, suffixNum) ) : value).toPrecision(precision));
                        var dotLessShortValue = (shortValue + '').replace(/[^a-zA-Z 0-9]+/g, '');
                        if (dotLessShortValue.length <= 2) {
                            break;
                        }
                    }
                    if (shortValue % 1 != 0)  shortNum = shortValue.toFixed(1);
                    newValue = shortValue + suffixes[suffixNum];
                }
                newArr[index] = newValue;
            });
            return newArr;
        }

        var labels = ["Google", "Microsoft", "Oracle", "IBM", "DB2", "MySQL"];
        var values = [6045745457, 7014544000, 5551040100, 4581140000, 3504510140, 578014245];
        var outputValues = abbreviateNumber(values);

        $('.column-chart-demo').simpleChart({
            title: {
                text: 'A chart illustration - dummy figures',
                align: 'center'
            },
            type: 'column',
            layout: {
                width: '90%',
                height: '275px'
            },
            item: {
                label: labels,
                value: values,
                outputValue: outputValues,
                color: ['#FF8811'],
                prefix: '$',
                suffix: '',
                render: {
                    margin: 1.4,
                    size: 'relative'
                }
            }
        });


    </script>
</body>
</html>
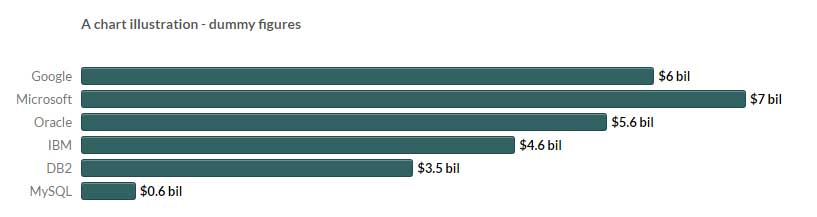
A demo of bar chart
Only the type of the chart is changed in the options from column to bar. Also, for this demo, the color of the chart is also changed. See the code and the output:
The code:
<!DOCTYPE html>
<html>
<head>
    <link rel="stylesheet" href="css/jquery-simple-chart/simple-chart.css">
    <link href="https://fonts.googleapis.com/css?family=Montserrat:300,400,600|Lato:300, 400i,700,700i" rel="stylesheet">
    <style>
        body { padding:100px; background-color:#eaeff5 }
        section { float:left; width:100%; padding:10px; margin:40px 0;  background-color:#fff; box-shadow:0 15px 40px rgba(0,0,0,.1) }
    </style>

</head>
<body>
    <div class="sc-wrapper">
        <section class="sc-section">
            <div class="demo-bar-chart"></div>
        </section>

    </div>
    <script src="https://cdnjs.cloudflare.com/ajax/libs/jquery/3.1.1/jquery.min.js"></script>
    <script src="js/jquery-simple-chart/simple-chart.js"></script>
    <script>
        //        Source: https://stackoverflow.com/questions/10599933/convert-long-number-into-abbreviated-string-in-javascript-with-a-special-shortn
        function abbreviateNumber(arr) {
            var newArr = [];
            $.each(arr, function (index, value) {
                var newValue = value;
                if (value >= 1000) {
                    var suffixes = [" ", " K", " mil", " bil", " t"];
                    var suffixNum = Math.floor(("" + value).length / 3);
                    var shortValue = '';
                    for (var precision = 2; precision >= 1; precision--) {
                        shortValue = parseFloat((suffixNum != 0 ? (value / Math.pow(1000, suffixNum) ) : value).toPrecision(precision));
                        var dotLessShortValue = (shortValue + '').replace(/[^a-zA-Z 0-9]+/g, '');
                        if (dotLessShortValue.length <= 2) {
                            break;
                        }
                    }
                    if (shortValue % 1 != 0)  shortNum = shortValue.toFixed(1);
                    newValue = shortValue + suffixes[suffixNum];
                }
                newArr[index] = newValue;
            });
            return newArr;
        }

        var labels = ["Google", "Microsoft", "Oracle", "IBM", "DB2", "MySQL"];
        var values = [6045745457, 7014544000, 5551040100, 4581140000, 3504510140, 578014245];
        var outputValues = abbreviateNumber(values);

        $('.demo-bar-chart').simpleChart({
            title: {
                text: 'A chart illustration - dummy figures',
                align: 'left'
            },
            type: 'bar',
            layout: {
                width: '90%',
                height: '295px'
            },
            item: {
                label: labels,
                value: values,
                outputValue: outputValues,
                color: ['#316262'],
                prefix: '$',
                suffix: '',
                render: {
                    margin: 1.4,
                    size: 'relative'
                }
            }
        });


    </script>
</body>
</html>
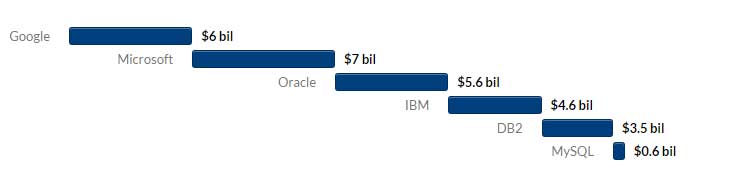
A demo of waterfall chart type
In the render option, the size is set as absolute while the type option is the waterfall. Again the color of the chart is changed by using the item option. See the demo of waterfall chart with the same dummy figures:
Complete code
<!DOCTYPE html>
<html>
<head>
    <link rel="stylesheet" href="css/jquery-simple-chart/simple-chart.css">
    <link href="https://fonts.googleapis.com/css?family=Montserrat:300,400,600|Lato:300, 400i,700,700i" rel="stylesheet">
    <style>
        body { padding:100px; background-color:#eaeff5 }
        section { float:left; width:100%; padding:10px; margin:40px 0;  background-color:#fff; box-shadow:0 15px 40px rgba(0,0,0,.1) }
    </style>

</head>
<body>
    <div class="sc-wrapper">
        <section class="sc-section">
            <div class="demo-waterfall-chart"></div>
        </section>

    </div>
    <script src="https://cdnjs.cloudflare.com/ajax/libs/jquery/3.1.1/jquery.min.js"></script>
    <script src="js/jquery-simple-chart/simple-chart.js"></script>
    <script>
        //        Source: https://stackoverflow.com/questions/10599933/convert-long-number-into-abbreviated-string-in-javascript-with-a-special-shortn
        function abbreviateNumber(arr) {
            var newArr = [];
            $.each(arr, function (index, value) {
                var newValue = value;
                if (value >= 1000) {
                    var suffixes = [" ", " K", " mil", " bil", " t"];
                    var suffixNum = Math.floor(("" + value).length / 3);
                    var shortValue = '';
                    for (var precision = 2; precision >= 1; precision--) {
                        shortValue = parseFloat((suffixNum != 0 ? (value / Math.pow(1000, suffixNum) ) : value).toPrecision(precision));
                        var dotLessShortValue = (shortValue + '').replace(/[^a-zA-Z 0-9]+/g, '');
                        if (dotLessShortValue.length <= 2) {
                            break;
                        }
                    }
                    if (shortValue % 1 != 0)  shortNum = shortValue.toFixed(1);
                    newValue = shortValue + suffixes[suffixNum];
                }
                newArr[index] = newValue;
            });
            return newArr;
        }

        var labels = ["Google", "Microsoft", "Oracle", "IBM", "DB2", "MySQL"];
        var values = [6045745457, 7014544000, 5551040100, 4581140000, 3504510140, 578014245];
        var outputValues = abbreviateNumber(values);

        $('.demo-waterfall-chart').simpleChart({
            title: {
                text: 'A chart illustration - dummy figures',
                align: 'left'
            },
            type: 'waterfall',
            layout: {
                width: '90%',
                height: '295px'
            },
            item: {
                label: labels,
                value: values,
                outputValue: outputValues,
                color: ['#003F7D'],
                prefix: '$',
                suffix: '',
                render: {
                    margin: 0,
                    size: 'absolute'
                }
            }
        });


    </script>
</body>
</html>
Other types of charts
Similarly, you may create the progress and step charts by using these values for the type option:
For progress chart:
type: ‘progress’
For step chart:
type: ‘step’